BigBear.ai Announces Second Quarter 2026 Results; Delivers 13% Growth, 20+ New Contract Wins, and Expanded Margins; Affirms Full Year Revenue Guidance
Delivers Q2 2026 revenue of $36.7 million, increasing 13% year-over-year Expanded Q2 gross margins by 781 basis points

Press Release Disclaimer: This is a press release distributed through the XPR Media network. It has not been independently verified by our newsroom.


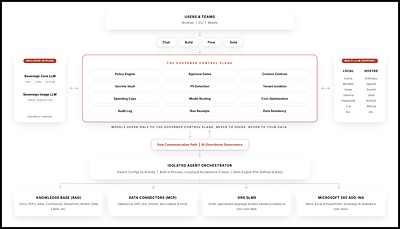
BigBear.ai Holdings, Inc. (NYSE: BBAI) (“BigBear.ai” or the “Company”), a specialized defense & security technology company providing mission-ready AI, today announced financial results for the second quarter of 2026 and issued an investor presentation that has been posted to the Investor Relations section of the Company’s website.
“It has been another strong quarter. Double-digit growth, significant margin expansion and more than 20 new contracts show that the BigBear.ai leadership team is following through on our commitments. We are in a strong financial position with $410 million of cash and investments, we’re on track for our target of 17% revenue growth, and we intend to accelerate. The second half of 2026 is all about execution discipline and positioning ourselves for accretive, catalytic M&A and building momentum for even stronger topline growth in 2027,” said Kevin McAleenan, CEO of BigBear.ai.
“BigBear.ai is in an excellent position to take advantage of the rapid expansion of investment and innovation in defense technology, which shows no signs of slowing down, given the macro environment. We have steadily been maturing the underlying financial discipline of the company and have significant cash in reserve so that when the right opportunity presents itself, we can move fast,” said Sean Ricker, CFO of BigBear.ai.
Financial Highlights
- Revenue increased 13% to $36.7 million for the second quarter of 2026, compared to $32.5 million for the second quarter of 2025 due to revenue from Ask Sage’s GenAI Platforms and Products.
- Gross margin was 32.8% in the second quarter of 2026, compared to 25.0% in the second quarter of 2025, due to increased volume from Ask Sage’s higher margin GenAI Platforms and Products in the second quarter of 2026 as compared to the second quarter of 2025.
- Selling, general, and administrative expenses increased $10.4 million from $21.5 million in the second quarter of 2025 to $31.8 million in the second quarter of 2026. The increase was primarily driven by increased intangible asset amortization from the Ask Sage acquisition, increased legal and proxy expenses related to our special stockholder meeting and establishing our new Retail Voting Program, and increased sales and marketing expenses resulting from partnerships and expanding our growth team.
- Net loss in the second quarter of 2026 was $25.7 million, compared to a net loss of $228.6 million for the second quarter of 2025. The decrease in net loss was primarily driven by a decrease in the loss due to non-cash changes in the fair value of derivatives of $135.3 million, a decrease of goodwill impairment of $70.6 million, a decrease in interest expense of $4.1 million, higher gross margin of $3.9 million and increased interest income of $2.1 million. These were partially offset by higher SG&A expenses of $10.4 million, described above, as well as an increase in research and development costs of $3.2 million.
- Non-GAAP Adjusted EBITDA* of $(11.6) million for the second quarter of 2026 compared to $(8.5) million for the second quarter of 2025 is primarily driven by an increase in SG&A expenses of $10.4 million, partially offset by higher gross margin of $3.9 million.
The above information on financial outlook, and other sections of this release contain forward-looking statements, which are based on the Company’s current expectations. Actual results may differ materially from those projected. It is the Company’s practice not to incorporate adjustments into its financial outlook for proposed acquisitions, divestitures, changes in law, or new accounting standards until such items have been consummated, enacted, or adopted, as the case may be. For additional factors that may impact the Company’s actual results, refer to the “Forward-Looking Statements” section in this release.
|
*EBITDA and Adjusted EBITDA are non-GAAP financial measures. See the “Non-GAAP Financial Measures” section in this press release for additional information and reconciliations. |
|
Summary of Results for the Second Quarter Ended June 30, 2026 and June 30, 2025 (Unaudited) |
|||||||||||||||
|
|
Three Months Ended June 30, |
|
Six Months Ended |
||||||||||||
|
$ thousands (expect per share amounts) |
|
2026 |
|
|
|
2025 |
|
|
|
2026 |
|
|
|
2025 |
|
|
Revenues |
$ |
36,749 |
|
|
$ |
32,472 |
|
|
$ |
71,184 |
|
|
$ |
67,229 |
|
|
Cost of revenues |
|
24,698 |
|
|
|
24,359 |
|
|
|
47,412 |
|
|
|
51,728 |
|
|
Gross margin |
|
12,051 |
|
|
|
8,113 |
|
|
|
23,772 |
|
|
|
15,501 |
|
|
Operating expenses: |
|
|
|
|
|
|
|
||||||||
|
Selling, general and administrative |
|
31,848 |
|
|
|
21,487 |
|
|
|
61,073 |
|
|
|
44,219 |
|
|
Research and development |
|
7,562 |
|
|
|
4,393 |
|
|
|
13,095 |
|
|
|
8,559 |
|
|
Restructuring charges |
|
384 |
|
|
|
1,899 |
|
|
|
384 |
|
|
|
3,597 |
|
|
Transaction expenses |
|
815 |
|
|
|
— |
|
|
|
2,033 |
|
|
|
— |
|
|
Goodwill impairment |
|
— |
|
|
|
70,636 |
|
|
|
— |
|
|
|
70,636 |
|
|
Operating loss |
|
(28,558 |
) |
|
|
(90,302 |
) |
|
|
(52,813 |
) |
|
|
(111,510 |
) |
|
Interest expense |
|
307 |
|
|
|
4,419 |
|
|
|
624 |
|
|
|
9,535 |
|
|
Interest income |
|
(3,817 |
) |
|
|
(1,704 |
) |
|
|
(7,602 |
) |
|
|
(2,260 |
) |
|
Net increase in fair value of derivatives |
|
471 |
|
|
|
135,751 |
|
|
|
20,596 |
|
|
|
169,087 |
|
|
Loss on extinguishment of debt |
|
— |
|
|
|
— |
|
|
|
15,826 |
|
|
|
2,577 |
|
|
Other expense (income) |
|
225 |
|
|
|
(163 |
) |
|
|
236 |
|
|
|
117 |
|
|
Loss before taxes |
|
(25,744 |
) |
|
|
(228,605 |
) |
|
|
(82,493 |
) |
|
|
(290,566 |
) |
|
Income tax expense |
|
5 |
|
|
|
14 |
|
|
|
19 |
|
|
|
39 |
|
|
Net loss |
$ |
(25,749 |
) |
|
$ |
(228,619 |
) |
|
$ |
(82,512 |
) |
|
$ |
(290,605 |
) |
|
|
|
|
|
|
|
|
|
||||||||
|
Basic and diluted net loss per share |
$ |
(0.05 |
) |
|
$ |
(0.71 |
) |
|
$ |
(0.17 |
) |
|
$ |
(0.97 |
) |
|
|
|
|
|
|
|
|
|
||||||||
|
Weighted-average shares outstanding: |
|
|
|
|
|
|
|
||||||||
|
Basic |
|
479,119,921 |
|
|
|
320,591,204 |
|
|
|
476,079,687 |
|
|
|
299,666,133 |
|
|
Diluted |
|
479,119,921 |
|
|
|
320,591,204 |
|
|
|
476,079,687 |
|
|
|
299,666,133 |
|
|
Consolidated Balance Sheets as of June 30, 2026 and December 31, 2025 (Unaudited) |
|||||||
|
|
|
|
|
||||
|
$ in thousands (except per share amounts) |
June 30, |
|
December 31, 2025 |
||||
|
Assets |
|
|
|
||||
|
Current assets: |
|
|
|
||||
|
Cash and cash equivalents |
$ |
36,278 |
|
|
$ |
87,126 |
|
|
Restricted cash |
|
1,787 |
|
|
|
5,521 |
|
|
Available for sale investments |
|
282,913 |
|
|
|
200,461 |
|
|
Accounts receivable, less allowance for credit losses |
|
30,975 |
|
|
|
22,703 |
|
|
Contract assets |
|
— |
|
|
|
218 |
|
|
Prepaid expenses and other current assets |
|
20,926 |
|
|
|
14,514 |
|
|
Total current assets |
|
372,879 |
|
|
|
330,543 |
|
|
Non-current assets: |
|
|
|
||||
|
Property and equipment, net |
|
1,891 |
|
|
|
1,562 |
|
|
Goodwill |
|
238,570 |
|
|
|
241,100 |
|
|
Intangible assets, net |
|
130,844 |
|
|
|
139,470 |
|
|
Available for sale investments |
|
90,612 |
|
|
|
173,949 |
|
|
Right-of-use assets |
|
5,657 |
|
|
|
7,063 |
|
|
Other non-current assets |
|
859 |
|
|
|
860 |
|
|
Total assets |
$ |
841,312 |
|
|
$ |
894,547 |
|
|
|
|
|
|
||||
|
Liabilities and stockholders’ equity |
|
|
|
||||
|
Current liabilities: |
|
|
|
||||
|
Accounts payable |
$ |
11,219 |
|
|
$ |
6,088 |
|
|
Current portion of long-term debt, net |
|
16,643 |
|
|
|
16,560 |
|
|
Accrued liabilities |
|
15,690 |
|
|
|
19,649 |
|
|
Contract liabilities |
|
10,180 |
|
|
|
14,756 |
|
|
Current portion of long-term lease liability |
|
846 |
|
|
|
1,095 |
|
|
Derivative liabilities |
|
10,455 |
|
|
|
116,906 |
|
|
Other current liabilities |
|
694 |
|
|
|
10,466 |
|
|
Total current liabilities |
|
65,727 |
|
|
|
185,520 |
|
|
Non-current liabilities: |
|
|
|
||||
|
Long-term debt, net |
|
— |
|
|
|
90,484 |
|
|
Long-term lease liability |
|
5,261 |
|
|
|
6,673 |
|
|
Total liabilities |
|
70,988 |
|
|
|
282,677 |
|
|
Stockholders’ equity |
|
|
|
||||
|
Common stock, par value $0.0001; 1,000,000,000 shares authorized and 479,494,493 shares issued and outstanding at June 30, 2026 and 500,000,000 shares authorized and 436,955,655 shares issued and outstanding at December 31, 2025 |
|
49 |
|
|
|
46 |
|
|
Additional paid-in capital |
|
1,719,285 |
|
|
|
1,534,792 |
|
|
Treasury stock, at cost; zero shares at June 30, 2026 and 9,952,803 shares at December 31, 2025 |
|
— |
|
|
|
(57,350 |
) |
|
Accumulated deficit |
|
(948,067 |
) |
|
|
(865,555 |
) |
|
Accumulated other comprehensive loss |
|
(943 |
) |
|
|
(63 |
) |
|
Total stockholders’ equity |
|
770,324 |
|
|
|
611,870 |
|
|
Total liabilities and stockholders’ equity |
$ |
841,312 |
|
|
$ |
894,547 |
|
|
Consolidated Statements of Cash Flows for the Second Quarter Ended June 30, 2026 and June 30, 2025 (Unaudited) |
|||||||||||||||
|
|
Three Months Ended June 30, |
|
Six Months Ended |
||||||||||||
|
$ in thousands |
|
2026 |
|
|
|
2025 |
|
|
|
2026 |
|
|
|
2025 |
|
|
Cash flows from operating activities: |
|
|
|
|
|
|
|
||||||||
|
Net loss |
$ |
(25,749 |
) |
|
$ |
(228,619 |
) |
|
$ |
(82,512 |
) |
|
$ |
(290,605 |
) |
|
Adjustments to reconcile net loss to net cash used in operating activities: |
|
|
|
|
|
|
|
||||||||
|
Depreciation and amortization expense |
|
6,806 |
|
|
|
3,451 |
|
|
|
13,887 |
|
|
|
6,921 |
|
|
Amortization of debt discount and issuance costs |
|
41 |
|
|
|
2,026 |
|
|
|
82 |
|
|
|
4,790 |
|
|
Accretion of discount on investments in debt securities |
|
(257 |
) |
|
|
— |
|
|
|
(638 |
) |
|
|
— |
|
|
Equity-based compensation expense |
|
4,743 |
|
|
|
4,319 |
|
|
|
8,166 |
|
|
|
11,719 |
|
|
Goodwill impairment |
|
— |
|
|
|
70,636 |
|
|
|
— |
|
|
|
70,636 |
|
|
Non-cash lease expense |
|
196 |
|
|
|
254 |
|
|
|
429 |
|
|
|
624 |
|
|
Provision for doubtful accounts |
|
42 |
|
|
|
311 |
|
|
|
42 |
|
|
|
351 |
|
|
Loss on extinguishment of debt |
|
— |
|
|
|
— |
|
|
|
15,826 |
|
|
|
2,577 |
|
|
Increase in fair value of derivatives |
|
471 |
|
|
|
135,751 |
|
|
|
20,596 |
|
|
|
169,087 |
|
|
Changes in assets and liabilities: |
|
|
|
|
|
|
|
||||||||
|
(Increase) decrease in accounts receivable |
|
(8,208 |
) |
|
|
5,919 |
|
|
|
(8,868 |
) |
|
|
10,267 |
|
|
Decrease (increase) in contract assets |
|
874 |
|
|
|
(189 |
) |
|
|
218 |
|
|
|
194 |
|
|
(Increase) decrease in prepaid expenses and other assets |
|
(5,664 |
) |
|
|
1,203 |
|
|
|
(6,003 |
) |
|
|
(592 |
) |
|
Increase (decrease) in accounts payable |
|
6,986 |
|
|
|
(876 |
) |
|
|
5,002 |
|
|
|
(5,039 |
) |
|
(Decrease) increase in accrued expenses |
|
(50 |
) |
|
|
319 |
|
|
|
(584 |
) |
|
|
4,765 |
|
|
(Decrease) increase in contracts liabilities |
|
(1,092 |
) |
|
|
1,449 |
|
|
|
(4,542 |
) |
|
|
1,925 |
|
|
(Decrease) increase in other liabilities |
|
(1,346 |
) |
|
|
178 |
|
|
|
(1,309 |
) |
|
|
1,848 |
|
|
Net cash used in operating activities |
|
(22,207 |
) |
|
|
(3,868 |
) |
|
|
(40,208 |
) |
|
|
(10,532 |
) |
|
Cash flows from investing activities: |
|
|
|
|
|
|
|
||||||||
|
Purchases of investments in debt securities |
|
(78,986 |
) |
|
|
— |
|
|
|
(78,986 |
) |
|
|
— |
|
|
Proceeds from maturities and sales of investments in debt securities |
|
36,261 |
|
|
|
— |
|
|
|
79,486 |
|
|
|
— |
|
|
Acquisition of businesses, net of cash acquired |
|
— |
|
|
|
— |
|
|
|
(10,183 |
) |
|
|
— |
|
|
Purchases of property and equipment |
|
(316 |
) |
|
|
(5 |
) |
|
|
(635 |
) |
|
|
(85 |
) |
|
Capitalized software development costs |
|
— |
|
|
|
(1,159 |
) |
|
|
— |
|
|
|
(2,699 |
) |
|
Net cash used in investing activities |
|
(43,041 |
) |
|
|
(1,164 |
) |
|
|
(10,318 |
) |
|
|
(2,784 |
) |
|
Cash flows from financing activities: |
|
|
|
|
|
|
|
||||||||
|
Proceeds from issuance of shares for exercised RDO and PIPE warrants |
|
— |
|
|
|
— |
|
|
|
— |
|
|
|
64,673 |
|
|
Payment of Private Placement and Registered Direct Offering transaction costs |
|
— |
|
|
|
— |
|
|
|
— |
|
|
|
(551 |
) |
|
Proceeds from at-the-market offering |
|
— |
|
|
|
293,431 |
|
|
|
— |
|
|
|
300,000 |
|
|
Payment of transaction costs for at-the-market offering |
|
— |
|
|
|
(5,135 |
) |
|
|
— |
|
|
|
(5,250 |
) |
|
Repayment of short-term borrowings |
|
— |
|
|
|
(85 |
) |
|
|
— |
|
|
|
(451 |
) |
|
Payment of debt issuance costs to third parties |
|
— |
|
|
|
(337 |
) |
|
|
— |
|
|
|
(4,679 |
) |
|
Payment of deferred purchase consideration |
|
(4,523 |
) |
|
|
— |
|
|
|
(4,523 |
) |
|
|
— |
|
|
Proceeds from exercise of options |
|
13 |
|
|
|
240 |
|
|
|
80 |
|
|
|
1,633 |
|
|
Issuance of common stock upon ESPP purchase |
|
1,590 |
|
|
|
1,069 |
|
|
|
1,590 |
|
|
|
1,069 |
|
|
Payments of tax withholding from the issuance of common stock |
|
(497 |
) |
|
|
(361 |
) |
|
|
(1,347 |
) |
|
|
(1,679 |
) |
|
Net cash (used in) provided by financing activities |
|
(3,417 |
) |
|
|
288,822 |
|
|
|
(4,200 |
) |
|
|
354,765 |
|
|
Effect of foreign currency rate changes on cash, cash equivalents, and restricted cash |
|
24 |
|
|
|
(555 |
) |
|
|
144 |
|
|
|
(745 |
) |
|
Net (decrease) increase in cash, cash equivalents and restricted cash |
|
(68,641 |
) |
|
|
283,235 |
|
|
|
(54,582 |
) |
|
|
340,704 |
|
|
Cash, cash equivalents, and restricted cash at the beginning of the period |
|
106,706 |
|
|
|
107,610 |
|
|
|
92,647 |
|
|
|
50,141 |
|
|
Cash, cash equivalents, and restricted cash at the end of the period |
$ |
38,065 |
|
|
$ |
390,845 |
|
|
$ |
38,065 |
|
|
$ |
390,845 |
|
|
EBITDA* and Adjusted EBITDA* for the Second Quarter June 30, 2026 and June 30, 2025 (Unaudited) |
|||||||||||||||
|
|
Three Months Ended |
|
Six Months Ended |
||||||||||||
|
$ thousands |
|
2026 |
|
|
|
2025 |
|
|
|
2026 |
|
|
|
2025 |
|
|
Net loss |
$ |
(25,749 |
) |
|
$ |
(228,619 |
) |
|
$ |
(82,512 |
) |
|
$ |
(290,605 |
) |
|
Interest expense |
|
307 |
|
|
|
4,419 |
|
|
|
624 |
|
|
|
9,535 |
|
|
Interest income |
|
(3,817 |
) |
|
|
(1,704 |
) |
|
|
(7,602 |
) |
|
|
(2,260 |
) |
|
Income tax expense |
|
5 |
|
|
|
14 |
|
|
|
19 |
|
|
|
39 |
|
|
Depreciation and amortization |
|
6,806 |
|
|
|
3,451 |
|
|
|
13,887 |
|
|
|
6,921 |
|
|
EBITDA |
|
(22,448 |
) |
|
|
(222,439 |
) |
|
|
(75,584 |
) |
|
|
(276,370 |
) |
|
Adjustments: |
|
|
|
|
|
|
|
||||||||
|
Equity-based compensation |
|
4,743 |
|
|
|
4,319 |
|
|
|
8,166 |
|
|
|
11,719 |
|
|
Employer payroll taxes related to equity-based compensation(1) |
|
1,188 |
|
|
|
611 |
|
|
|
2,024 |
|
|
|
1,626 |
|
|
Net increase in fair value of derivatives(2) |
|
471 |
|
|
|
135,751 |
|
|
|
20,596 |
|
|
|
169,087 |
|
|
Restructuring charges(3) |
|
384 |
|
|
|
1,899 |
|
|
|
384 |
|
|
|
3,597 |
|
|
Non-recurring strategic initiatives(4) |
|
2,758 |
|
|
|
717 |
|
|
|
4,220 |
|
|
|
1,611 |
|
|
Non-recurring litigation(5) |
|
423 |
|
|
|
8 |
|
|
|
669 |
|
|
|
30 |
|
|
Transaction expenses(6) |
|
815 |
|
|
|
— |
|
|
|
2,033 |
|
|
|
— |
|
|
Non-recurring integration costs(7) |
|
94 |
|
|
|
— |
|
|
|
158 |
|
|
|
— |
|
|
Goodwill impairment(8) |
|
— |
|
|
|
70,636 |
|
|
|
— |
|
|
|
70,636 |
|
|
Loss on extinguishment of debt(9) |
|
— |
|
|
|
— |
|
|
|
15,826 |
|
|
|
2,577 |
|
|
Adjusted EBITDA |
$ |
(11,572 |
) |
|
$ |
(8,498 |
) |
|
$ |
(21,508 |
) |
|
$ |
(15,487 |
) |
|
(1) |
Includes employer payroll taxes due upon the vesting of equity awards granted to employees. |
|
(2) |
The change in fair value of derivatives during the three months ended June 30, 2026 consists of net losses related to the fair market value adjustments on the 2025 RDO Warrants, IPO private warrants, and 2026 Notes Conversion Option. The change in fair value of derivatives during the six months ended June 30, 2026 primarily relates to a $28.3 million mark-to-market loss for the 2029 Notes Conversion Options immediately prior to conversion. This was offset by net gains related to the fair market value adjustments on the 2025 RDO Warrants, IPO private warrants, and 2026 Notes Conversion Option of $7.7 million.
The change in fair value of derivatives during the three months ended June 30, 2025 relates to the remeasurement of the 2025 warrants, IPO warrants and the 2026 and 2029 Notes Conversion Options derivative liabilities. The change during the six months ended June 30, 2025, relates to the $14.0 million loss recorded upon the exercise of the 2024 RDO and 2024 PIPE Warrants and issuance of the warrants in 2025 in connection with the warrant exercise agreements entered into on February 5, 2025. During the six months ended June 30, 2025,loss related to a mark-to-market adjustment of $59.9M adjustment for the debt to equity conversions during the period was reported. There was an offsetting gain related to the fair market value adjustment on the 2025 warrants and the private warrants of $2.6 million. Additionally, there was an loss of $7.0 million fair market value adjustment of the 2026 and 2029 Notes Conversion Option, during the six months ended June 30, 2025. |
|
(3) |
Includes employee separation costs which are associated with strategic reviews of the Company’s capacity and future projections to better align the organization and cost structure and improve the affordability of its products and services. |
|
(4) |
Non-recurring professional fees incurred in connection with discrete, non-recurring strategic initiatives, including business transformation and strategy realignment consulting services which management does not consider part of the Company’s ongoing operating expenses. |
|
(5) |
Non-recurring litigation consists primarily of legal settlements and related fees for specific proceedings that we have determined arise outside of the ordinary course of business based on the following considerations which we assess regularly: (1) the frequency of similar cases that have been brought to date, or are expected to be brought within two years; (2) the complexity of the case; (3) the nature of the remedy(ies) sought, including the size of any monetary damages sought; (4) offensive versus defensive posture of us; (5) the counterparty involved; and (6) our overall litigation strategy. |
|
(6) |
Transaction expenses during the six months ended June 30, 2026 consist primarily of diligence, legal and other related expenses incurred associated with the Ask Sage and CargoSeer acquisitions. |
|
(7) |
Non-recurring internal integration costs related to the Ask Sage acquisition. |
|
(8) |
During the six months ended June 30, 2025, the company recognized a non-cash goodwill impairment charge primarily driven by a change in forecast during the second quarter of 2025. |
|
(9) |
Loss on extinguishment of debt is related to voluntary conversions of the 2029 Notes to common stock and the related extinguishment of unamortized debt discount and debt costs. |
|
*EBITDA and Adjusted EBITDA are non-GAAP financial measures. See the “Non-GAAP Financial Measures” section in this press release for additional information and reconciliations. |
Forward-Looking Statements
This release contains forward-looking statements regarding future events and our future results that are subject to the safe harbors created under the Securities Act of 1933 (the “Securities Act”), the Securities Exchange Act of 1934 (the “Exchange Act”) and the Private Securities Litigation Reform Act of 1995. Forward-looking statements generally are accompanied by words such as “believe,” “may,” “will,” “estimate,” “continue,” “anticipate,” “intend,” “expect,” “should,” “would,” “plan,” “predict,” “project,” “potential,” “seem,” “seek,” “future,” “outlook,” and similar expressions that predict or indicate future events or trends or that are not statements of historical matters. These forward-looking statements include, but are not limited to, statements regarding our industry, future events, and other statements that are not historical facts. These statements are based on current expectations and beliefs concerning future developments and their potential effects on us and should not be relied upon as representing BigBear.ai’s assessment as of any date subsequent to the date of this release. There can be no assurance that future developments affecting us will be those that we have anticipated. Many actual events and circumstances are beyond our control. These forward-looking statements are subject to a number of risks and uncertainties, including those relating to: changes in domestic and foreign business, market, financial, political, and legal conditions; the uncertainty of projected financial information; delays caused by factors outside of our control, including changes in fiscal or contracting policies or decreases in available government funding, including as a result of events such as war, incidents of terrorism, natural disasters, and public health concerns or epidemics; changes in government programs or applicable requirements; budgetary constraints, including any potential constraints as a result of recent or future federal government layoffs, including automatic reductions as a result of “sequestration” or similar measures and constraints imposed by any lapses in appropriations for the federal government or certain of its departments and agencies, including government shutdowns or the ability of the U.S. federal government to unilaterally cancel a contract with or without cause, and more specifically, the potential impact of the U.S. DOGE Service Temporary Organization on government spending and terminating contracts for convenience; the failure of contracts comprising backlog to result in revenue due to changes in funding, terminations for convenience, or option periods going unexercised; the impact of tariffs or other restrictive trade measures; implementation of spending limits or changes in budgetary constraints; influence by, or competition from, third parties with respect to pending, new, or existing contracts with government customers; changes in our ability to successfully compete for and receive task orders and generate revenue under Indefinite Delivery/Indefinite Quantity contracts; our ability to realize the benefits of the strategic partnerships; risks that the new businesses will not be integrated successfully or that the combined companies will not realize estimated cost savings; failure to realize anticipated benefits of the combined operations; potential delays or changes in the government appropriations or procurement processes; risks regarding the market and our customers accepting and adopting our products, including future new product offerings; the high degree of uncertainty of the level of demand for, and market utilization of, our solutions and products; our ability to successfully execute and realize the benefits of joint ventures, channel sales relationships, partnerships, strategic alliances, subcontracting opportunities, customer contracts and other commercial agreements to which we are a party; and those factors discussed in the Company’s reports and other documents filed with the SEC, including under the heading “Risk Factors.” If any of these risks materialize or our assumptions prove incorrect, actual results could differ materially from those projected by these forward-looking statements. There may be additional risks that we presently do not know or that we currently believe are immaterial which could also cause actual results to differ from those contained in the forward-looking statements. In addition, forward-looking statements reflect our expectations, plans or forecasts of future events and views as of the date of this release. We anticipate that subsequent events and developments will cause our assessments to change. However, we specifically disclaim any obligation to do so. Accordingly, undue reliance should not be placed upon the forward-looking statements.
Non-GAAP Financial Measures
The financial information and data contained in this press release is unaudited. Some of the financial information and data contained in this press release, such as EBITDA and Adjusted EBITDA, have not been prepared in accordance with United States generally accepted accounting principles (“GAAP”). To supplement our unaudited condensed consolidated financial statements, which are prepared and presented in accordance with GAAP in our press release, we also report certain non-GAAP financial measures. A “non-GAAP financial measure” refers to a numerical measure of a company’s historical or future financial performance, financial position, or cash flows that excludes (or includes) amounts that are included in (or excluded from) the most directly comparable measure calculated and presented in accordance with GAAP in such company’s financial statements. Non-GAAP financial measures should not be considered in isolation or as a substitute for the relevant GAAP measures and should be read in conjunction with information presented on a GAAP basis. Because not all companies use identical calculations, our presentation of non-GAAP measures may not be comparable to other similarly titled measures of other companies.
The presentation of these financial measures is not intended to be considered in isolation or as a substitute for, or superior to, financial information prepared and presented in accordance with GAAP and should not be considered measures of BigBear.ai’s liquidity. Investors are cautioned that there are material limitations associated with the use of non-GAAP financial measures as an analytical tool. In particular, many of the adjustments to our GAAP financial measures reflect the exclusion of certain items, as defined in our non-GAAP definitions below, which are recurring and will be reflected in our financial results for the foreseeable future. In addition, these measures may be different from non-GAAP financial measures used by other companies, even where similarly titled, limiting their usefulness for comparison purposes and therefore should not be used to compare BigBear.ai’s performance to that of other companies. We endeavor to compensate for the limitation of the non-GAAP financial measures presented by also providing the most directly comparable GAAP measures and descriptions of the reconciling items and adjustments to derive the non-GAAP financial measures.
We believe these non-GAAP financial measures provide investors and analysts with useful supplemental information about the financial performance of our business, enable comparison of financial results between periods where certain items may vary independent of business performance, and allow for greater transparency with respect to key measures used by management to operate and analyze our business over different periods of time.
EBITDA is defined as net loss before interest expense, interest income, income tax expense (benefit) and depreciation and amortization. Adjusted EBITDA is defined as EBITDA further adjusted for equity-based compensation, employer payroll taxes related to equity-based compensation, net increase in fair value of derivatives, restructuring charges, non-recurring strategic initiatives, non-recurring integration costs, non-recurring litigation, transaction expenses, goodwill impairment, and loss on extinguishment of debt.
Similar excluded expenses may be incurred in future periods when calculating these measures. BigBear.ai believes these non-GAAP measures of financial results provide useful information to management and investors regarding certain financial and business trends relating to the Company’s financial condition and results of operations. BigBear.ai believes that the use of these non-GAAP financial measures provides an additional tool for investors to use in evaluating projected operating results and trends and in comparing BigBear.ai’s financial measures with other similar companies, many of which present similar non-GAAP financial measures to investors.
Management does not consider these non-GAAP measures in isolation or as an alternative to financial measures determined in accordance with GAAP. The principal limitation of these non-GAAP financial measures is that they exclude significant expenses and income that are required by GAAP to be recorded in the Company’s financial statements. In addition, they are subject to inherent limitations as they reflect the exercise of judgment by management about which expense and income items are excluded or included in determining these non-GAAP financial measures.
Management uses EBITDA and Adjusted EBITDA as non-GAAP performance measures which are reconciled to the most directly comparable GAAP measure, in the tables included in this release. The Company does not reconcile forward-looking non-GAAP financial measures to the most directly comparable GAAP financial measure (or otherwise describe such forward-looking GAAP measure) because it is not able to forecast the most directly comparable measure calculated and presented in accordance with GAAP without unreasonable effort. Certain elements of the composition of the GAAP amounts are not predictable, making it impracticable for the Company to forecast. As a result, no guidance for the Company’s net (loss) income or reconciliation of the Company’s Adjusted EBITDA guidance is provided. For the same reasons, the Company is unable to assess the probable significance of the unavailable information, which could have a potentially significant impact on its future net income (loss).
About BigBear.ai
BigBear.ai is a specialized defense technology company, developing and deploying mission-ready AI solutions and services. Customers and partners rely on BigBear.ai’s predictive analytics capabilities in highly complex, distributed, mission-based operating environments. Headquartered in McLean, Virginia, BigBear.ai is a public company traded on the NYSE under the symbol BBAI. For more information, visit https://bigbear.ai/ and follow BigBear.ai on LinkedIn: @BigBear.ai and X: @BigBearai.
View source version on businesswire.com: https://www.businesswire.com/news/home/20260730306752/en/
Media gallery